


There are plants that rolled out a new CMMS, installed hundreds of condition monitoring sensors, built dashboards for everything, and still go down every week.
The numbers back this up. In January 2026, MaintainX surveyed 2,234 maintenance and operations leaders across the United States and Canada:
-
58% are already using AI somewhere in their operation, up from 44% the year before
-
79% had the same amount of unplanned downtime, or more, than the year before
-
Half of all teams still spend less than 40% of their time on planned work
The report explains the gap plainly. The organizations pulling ahead are not just buying the newest tool. They are pairing modern tools with strong fundamentals: disciplined scheduling, better training, knowledge capture, and a culture that treats machine data as a strategic asset.
And on page 8 they point to where it breaks down:
Many organizations now operate with modern CMMS or EAM platforms but still struggle with weak PM programs, poor schedule compliance, inconsistent root cause analysis, and limited planner capacity. Software is most effective when it supports strong maintenance fundamentals rather than substitutes for them.
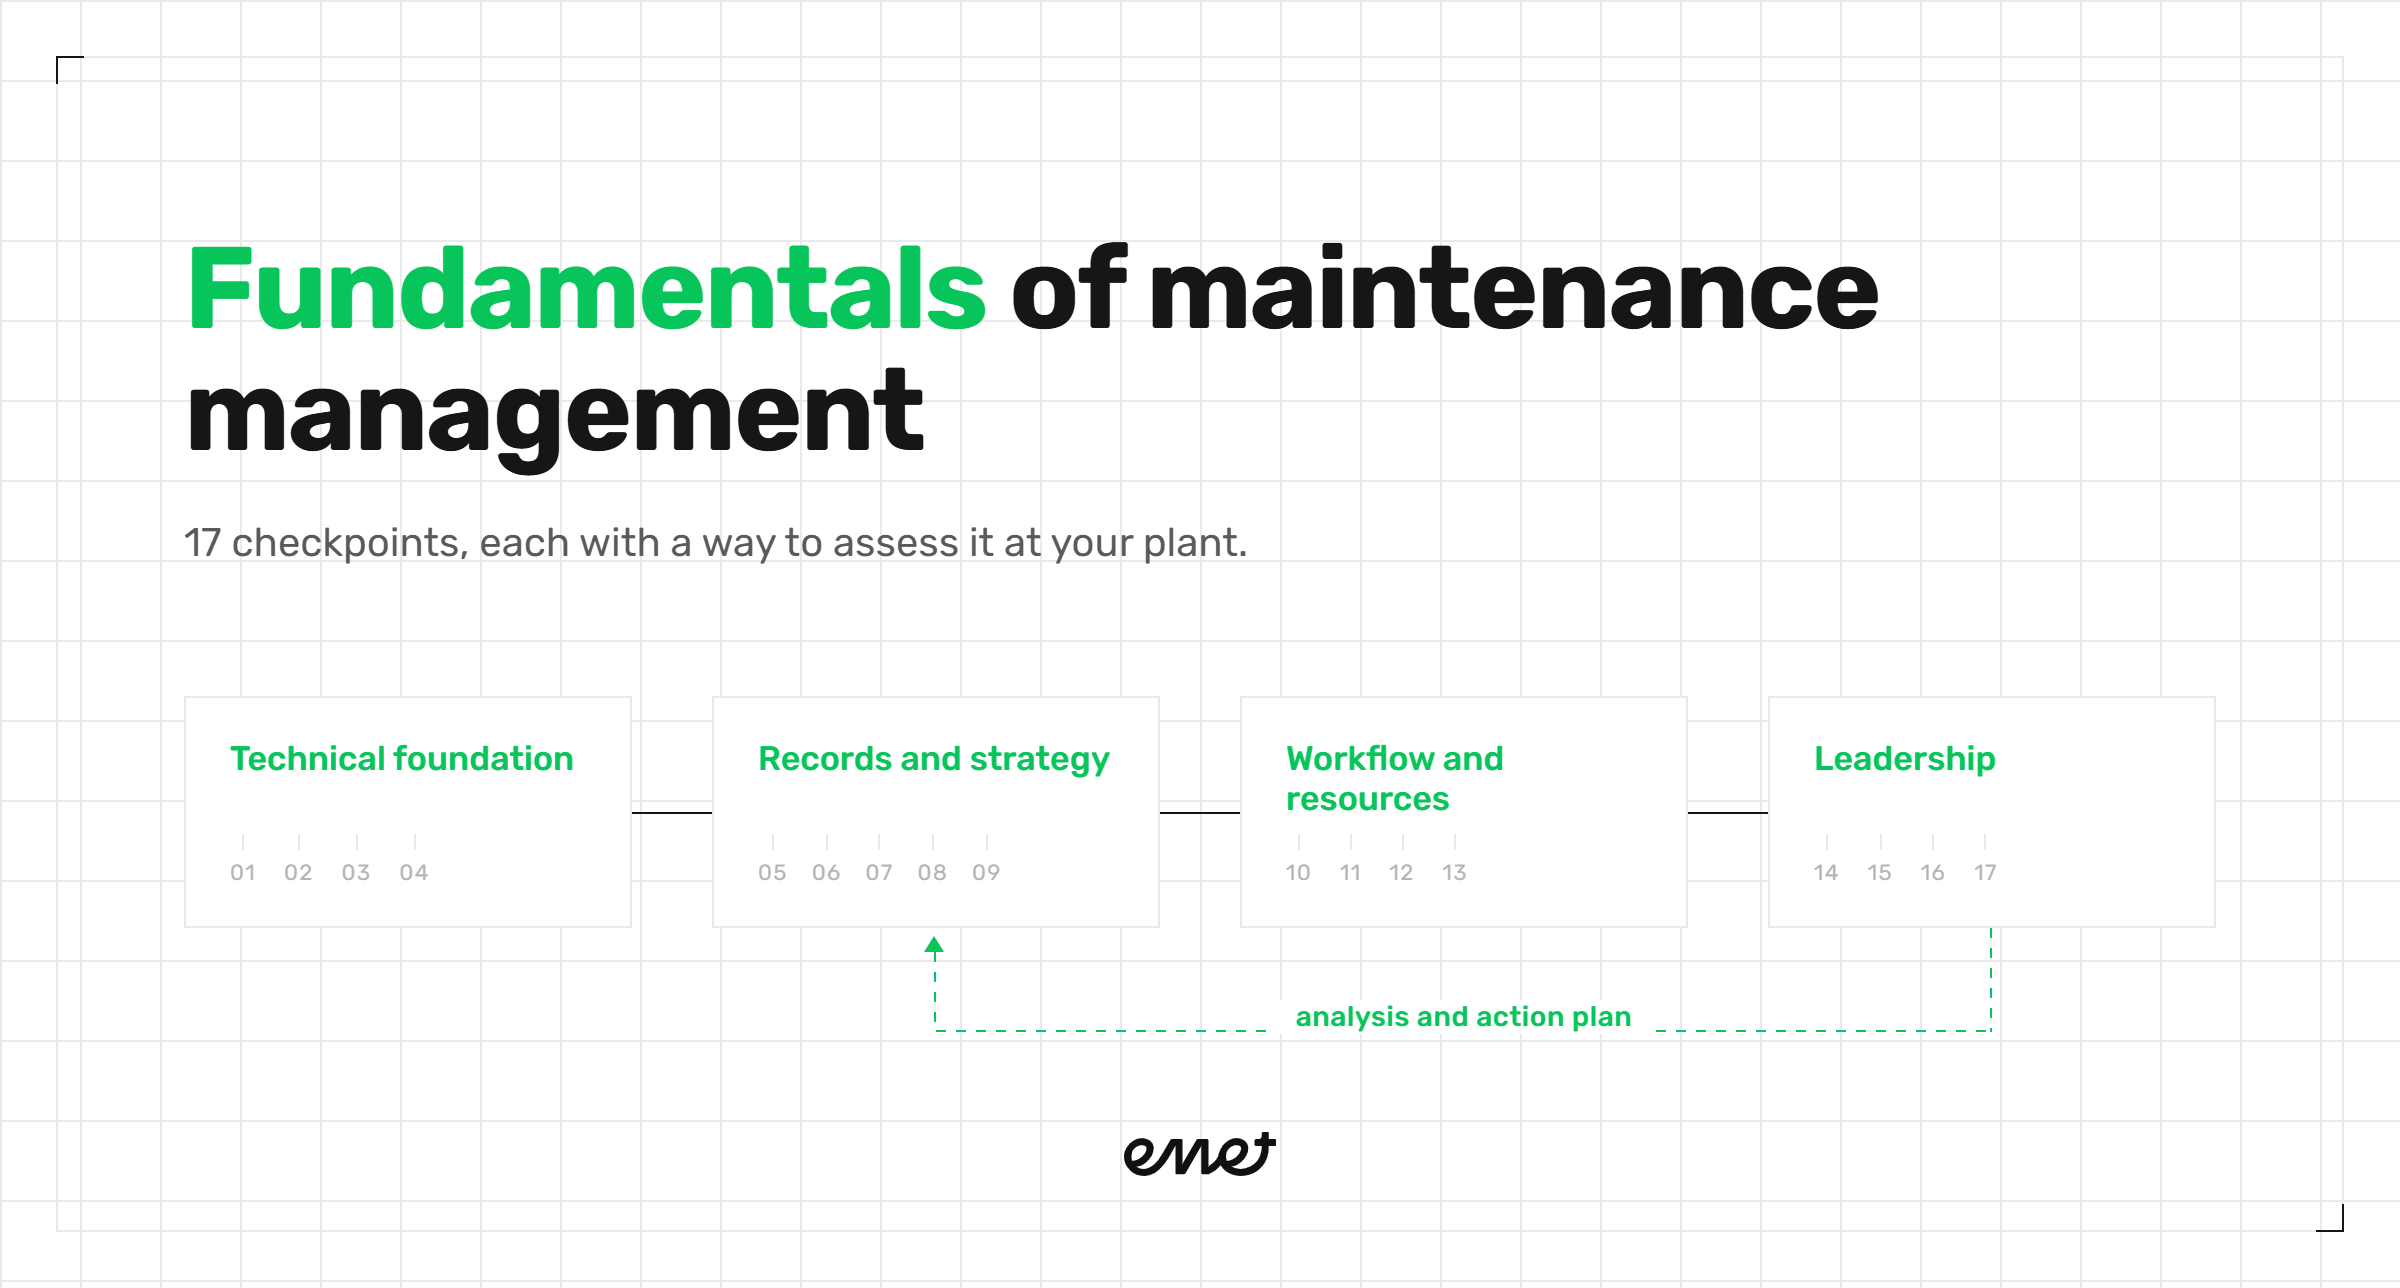
All four are real, and each one rests on things that come before it. That is what this article is about.
The problem with talking about fundamentals
Everyone agrees you need effective maintenance plans, a controlled backlog and clean master data. You read it, you agree, you save it, and by Monday nothing has changed. What is missing is a reference point, something concrete you can hold against your own plant and answer yes or no.
So every fundamental below comes with a way to check it.
Some of them you check by walking the floor, without asking anyone for access. Others require opening the CMMS or asking for a document. The two work best together, because what you see in the field raises the question and the system answers it.
Start with a walk
A maintenance professional with many years in the field once told me that when he visits a plant, one of the best indicators of how well maintenance is managed is the scrap bin.
He is right. I have seen scrap bins with motors, pumps and gearboxes that could have been rebuilt without any trouble. Nobody writes in a report that they decided to scrap an asset without assessing it, but the scrap bin shows it anyway. And what it shows is that there is no repair or replace policy, no control over repairable items, and nobody looking at the cost of that asset over its life.
That is why the first hour in a plant is worth so much. A system can be cleaned up the night before your visit. The floor cannot.
Other things anyone can assess on a walk:
-
Oil leaks at reservoirs, valves and cylinders
-
Automatic grease lubricators leaking
-
Dirt and grime on the line and on the equipment
-
Loose motor connections, exposed wiring, broken cable trays
-
A dirty, disorganized shop
-
How production and maintenance talk to each other
-
How maintenance’s own functions work together
One leak on its own does not tell you much. A machine that is going into a planned shutdown next month and happens to be leaking is a decision someone made. A leak with a drip pan under it since the last plant manager is a different story. What matters is how long it has been sitting there, in plain view of everyone, without anyone recording it.
1. Master data and criticality
Functional locations, asset hierarchy down to the sixth level or to the component, work centers, equipment class, and criticality backed by written criteria.
What you lose: Cost and history have nowhere to land. You know what you spent in the plant, and you cannot tell what you spent on a particular gearbox.
Criticality exists so you can decide where to put more resources: time, money and attention. I have had clients tell me everything in the plant was critical. When everything is critical, nothing is, and that shows up at the start of the shift.
How to check: Pick a critical asset and try to answer what it cost over the last 12 months. If the only answer lives at the functional location level, your hierarchy is too shallow to support a real decision.
Five machines go down at the start of the shift and you have one technician available. Which one do you hit first? If the answer depends on who happens to be in the room that morning, criticality is just a field somebody filled in.
2. Bills of material and item catalog
Coded parts with specifications, and a bill of material for each asset. This applies to stocked and non stocked items alike, with the supplier, expected price and worst case lead time defined before the emergency shows up.
Without a part number, the item never makes it into the BOM. Without a BOM, planning is working on guesswork.
How to check: Pull the maintenance purchase orders from the last year and count how many lines are free text. At one client, more than 9,000 lines were exactly that, with the same item bought under different descriptions by different areas, and nobody able to see it was the same item.
3. Technical documentation
Manuals, drawings, electrical schematics, hydraulic diagrams and parts catalogs, available from where the work actually happens.
How to check: Ask a technician to pull up the electrical schematic for a critical asset straight from the work order, and time it. If he has to walk to the office and dig through a folder, the documentation exists but it is not accessible.
4. Management of change
Every asset modification goes through a request, an assessment and an approval, with a defined workflow and an owner.
How to check: Pick one modification made in the last year and see whether the drawing, the maintenance plan, the BOM and the applicable procedures were updated afterward. It is common for the change to happen and the documentation to keep describing the old equipment.
5. Downtime and defect reporting
These are two different things. Downtime is the stoppage reported by operations, with defined fields and someone accountable per shift. And defect your rounds find that has not stopped anything yet.
How to check: Compare the downtime hours reported by operations against the hours charged to corrective work orders over the same period. When the two numbers do not line up, one of the two records is fiction. Then count how many abnormalities from your rounds turned into a work order last month.
6. Work orders
Every maintenance activity carries a work order with a defined type, status and priority. Whoever does the work records it, and closes it.
What you lose: Part of the work stays invisible. Cost does not reconcile, asset history is incomplete, and the backlog ends up describing a plant that does not exist.
Creating the work order is the first step. Closing it is a level above, because it means the CMMS has genuinely been adopted. When the supervisor or the planner has to close on behalf of the crew, both become a bottleneck.
How to check: What share of work orders is created and closed by the technician in the field? At Gerdau USA, after training more than 100 people across maintenance, production, safety, quality and engineering to raise work orders, orders created directly by technicians went up more than 300% in three months.
Then take five work orders that have been open for over a year and ask for the explanation on each one. Only one answer holds up: it depends on a major shutdown, on expensive resources, or on a skill the team does not have. The others you will hear are that nobody is managing it, that it became part of the scenery, or that nobody ever prioritized it.
7. Maintenance plans
Shift rounds, predictive, preventive and lubrication. Every task addresses a known failure mode, carries a parameter with its limits right there, and has a frequency justified by the condition of the asset. The plan carries its resources, and linked materials generate a reservation in the storeroom before the job runs.
What you lose: You hit 100% compliance on a plan that protects nothing, and the indicator stays green. The crew burns hours on work that does not address risk, and failures keep starting where nobody is looking.
How to check: Open five PM tasks. Does each one point to a failure mode? Is there a parameter with limits next to it, or just “inspect”? Are materials linked?
Count how many notifications and work orders came out of each plan over time. A monthly plan that has been running for three years without ever generating a single repair order is telling you something. And it could be telling you three things: the inspection is not happening, it is happening but never turns into a request, or the plan itself is poor. Perfect equipment is the fourth possibility, and it is almost never the right one.
Finally, how many plans were revised in the last 12 months because of a failure that was analyzed.
8. Standards for critical tasks
Critical maintenance tasks have a written standard covering lockout and tagout steps, tools, precautions, safety measures and PPE.
The same document does three jobs: the crew works to it, leadership audits against it, and new hires are trained on it.
How to check. Take the standard for a critical task and confirm whether it was used in the last leadership audit and in the training of your most recent hire.
9. Failure analysis
A defined trigger, a single method, a trained team, and the full loop: analysis, action plan, implementation.
How to check: The third part is where it almost always breaks. Take the analyses from the last 12 months and count how many actions were actually implemented, and how many of those changed a maintenance plan.
10. Planning and scheduling
A backlog with an owner. A weekly schedule agreed with maintenance and production leadership at least a week ahead. A tolerance window tied to each plan’s frequency. Materials and special tools staged before the job starts. And a planning and scheduling department that is actually staffed: planner, scheduler, inspector and job preparer, depending on the nature and strategy of the business.
What you lose: Compliance measured against a date that has already been pushed is measuring itself. And when nobody schedules the week, the crew sits waiting for something to break.
At one client, the planning team did an excellent job planning the down day. On every other day of the week, the crew had no schedule at all. The problem was not the crew. Nobody was building their schedule.
How to check: Measure compliance against the original plan date, not the latest one. Count how many times the work order has been rescheduled. In one report we built, work orders showed up with more than 40 reschedules, and because the system only stored the current due date, that history had to be reconstructed from the change log.
11. Shutdown and turnaround management
Weekly shutdowns and the annual turnaround. Scope defined and frozen, cost and duration estimated, schedule built ahead of time, and a review afterward.
How to check: How many days before the shutdown was the scope frozen, and how much of what was executed came in after that point. For the annual turnaround, whether the schedule with cost and duration existed six months out.
12. Shop and point of use
A clean, organized shop. Parts identified and binned. Wear parts under control. The kit for the next PM staged and labeled. Tooling available.
This usually gets filed under 5S and reduced to housekeeping. The real reason is different. When the machine goes down at two in the morning, the technician has to find the part.
And 5S done without judgment destroys value. I have heard more than one account of new leadership ordering a 5S in the shop and throwing out the entire technical documentation library. And of parts scrapped for having no movement in 12 months, with nobody asking whether it was a critical asset item with a sole supplier and a long lead time. A part like that sits for years, and that is exactly what it is there for.
How to check. Walk the shop and judge the organization. Then look at how many work orders stalled last quarter for want of a part or a tool.
13. Storeroom and spares
Inventory accuracy, bin locations, critical spares tied to each asset, repairable item management and control of outside repairs.
How to check: Inventory accuracy, with the usual reference above 97%. Share of emergency purchases over the period. And go back to the scrap bin: repairable items heading for scrap tell you there is no repair or replace policy.
14. People and skills
A skills matrix by area and by role, and a named owner for each asset or line.
How to check: Count how many technicians are qualified on hydraulics, PLCs and VFDs, and compare that against the technology installed in the plant. If you have 40 drives and two people who can configure them, you may have a technical dependency sitting inside your team.
15. Management routines
A standard calendar by role, a responsibility matrix, and daily, weekly and monthly meetings with an agenda and minutes.
How to check: Ask for the planner’s calendar and the supervisor’s calendar. If they do not exist as documents, the routine is improvised every day. Then look at whether the daily 24 hour review has a written agenda, and whether anyone records what was agreed.
16. KPIs and cost
A small set of indicators, each with an owner, a target and a defined review frequency. Cost per unit produced and budget by area.
The number of indicators says nothing about maturity. Most departments only measure results: MTBF, MTTR, availability, unplanned downtime hours, cost per ton. Those are lagging indicators, and they report what already happened. By the time the number shows up in the monthly meeting, the month is closed and so is the failure.
Maturity shows up when leading indicators are there too. Schedule compliance, share of time on planned work, backlog in weeks, PM completion within the tolerance window, share of work orders with a plan and materials linked. Those you can follow while the month is still running, with time left to correct course before the result lands.
How to check: List your indicators and split them into two groups: the ones that report what happened, and the ones that warn you first. If the second group is empty, every month you find out about the problem after it has already happened.
Then ask, for each indicator: who owns it, how often is it reviewed, and how many times did it trigger a recorded action last quarter.
17. Maintenance engineering
Maintenance policy, periodic stratification and Pareto analysis, audits against standards, maintainability improvement, an annual plan and a five year plan.
How to check: Ask for the last Pareto and ask what action came out of it. And ask whether a repair or replace policy exists as a document.
Back to the report
The four points MaintainX raises on page 8 map straight onto this list. Weak PM programs is item 7. Poor schedule compliance is item 10. Inconsistent root cause analysis is item 9. Limited planner capacity is items 10 and 15.
Click here to read the full report. It is worth your time.
These are fundamentals you can assess in your own operation today, and turn into an action plan to close the gaps you find. If you need a hand, the Emet team is here.
